Aims to establish a mechanism for the rapid design, development, testing and demonstration of Domain Application Products (DAP), and to demonstrate the mechanism by practical implementation of various DAPs designed to respond to specific stakeholder needs.
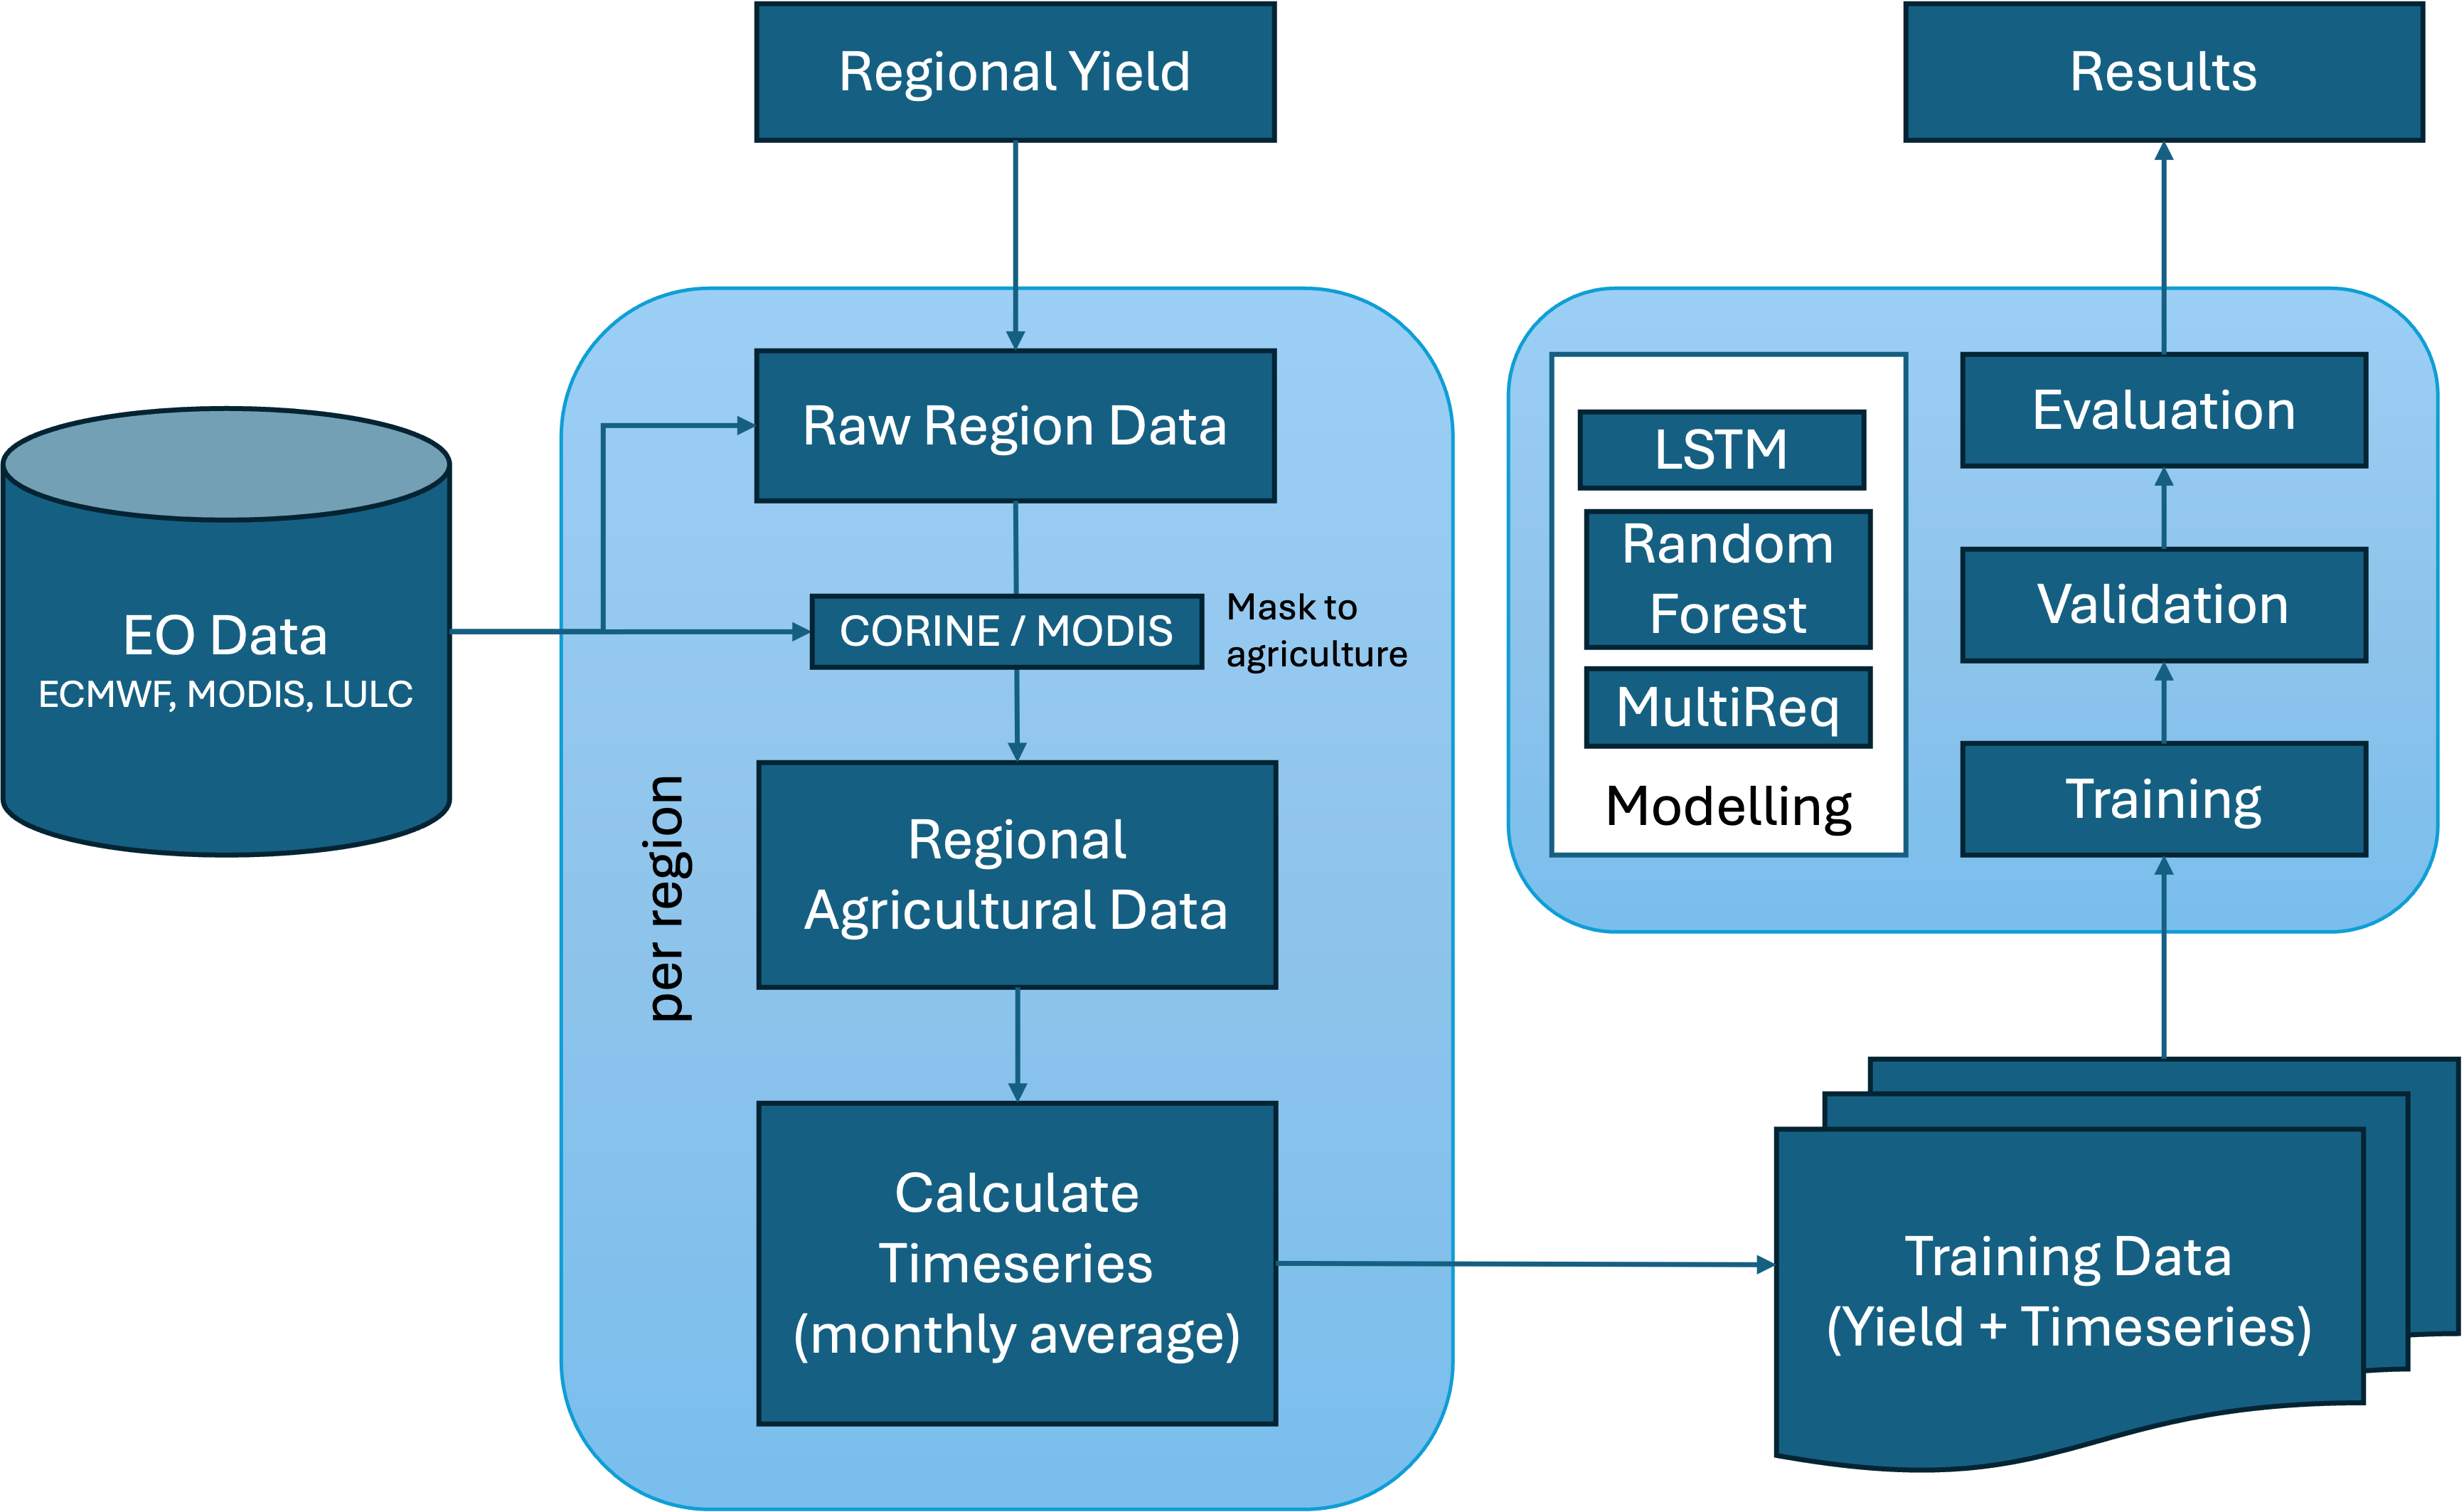
Accurate crop yield forecasts aid decision-making from agricultural stakeholders and increase the food security of nations around the World. Recent improvements in the accessibility to climatological data and ML methods allow these forecasts to be performed at a low cost to the developer. This study aims to use freely available climatological and crop yield data to predict the end of season (EOS) yields for four crops in Spain (sunflower, maize, wheat) and Poland (barley).
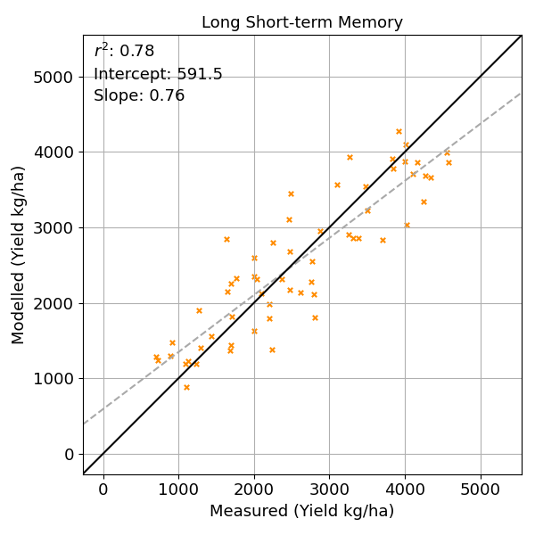
The crop yield prediction with the highest degree of accuracy was produced by a LSTM-tuned model for the crop yield of wheat throughout Spain, with a moderate correlation between modelled and in situ crop yields. It was found that Gross Primary Productivity (GPP) held the greatest influence on accurate prediction when predicting wheat in an the LSTM model, with temperature and Fraction of absorbed photosynthetically active radiation (FAPAR) being of approximately equal importance, but to a lesser degree.
Earth observation (EO) data provides an affordable, reliable, and timely source of information that can be used to enhance crop yield forecasting. The freely available data from the EO Copernicus Programme allows high-quality observations with frequent revisits, enhancing yield forecasting models' effectiveness.
Operational yield forecasting approaches are often based on field surveys, empirical regression models, or crop simulation models. The most straightforward approach to link remote sensing to yield forecasts establishes an empirical relationship between in situ yield statistics and remote sensing parameters.
Global and regional crop yield forecasting systems currently exist to provide up-to-date information on food production. Many of these studies contains vast datasets, complex methods, and are performed over many countries at national and sub-national scales. These take a considerable amount of time to develop, test, and publish. Some studies use data that is not clearly and freely available
ARGANS have been tasked with testing a range of machine learning (ML) and other methods to predict crop yields at end of season (EOS) across Europe.
Monthly averaged timeseries for a range of climatological and biophysical variables were ingested into four models: multi-linear regression (MLR), support vector regression (SVR), random forest regression (RFR), and long short-term memory (LSTM). These were selected due to their varying degrees of complexity and popularity within the literature. The timeseries ingested for each crop was dependent on the crop calendar, defined by the United States Department of Agriculture (USDA). The accuracy of each model was tested using the root mean square error (RMSE) and r 2. The models were trained and validated using in situ crop data, collected from the agricultural ministries in Poland and Spain.
The LSTM model produced the most accurate predictions for wheat in Spain, with a RMSE of 0.5 and an r 2 of 0.7. The SVR model produced the most accurate predictions for sunflower in Spain, with a RMSE of 0.5 and an r 2 of 0.6. The RFR model produced the most accurate predictions for maize in Spain, with a RMSE of 0.5 and an r 2 of 0.6. The MLR model produced the most accurate predictions for barley in Poland, with a RMSE of 0.5 and an r 2 of 0.6.
It was found that the LSTM model produced the most accurate predictions for wheat in Spain, with a moderate correlation between modelled and in situ crop yields. It was found that Gross Primary Productivity (GPP) held the greatest influence on accurate prediction when predicting wheat in an the LSTM model, with temperature and Fraction of absorbed photosynthetically active radiation (FAPAR) being of approximately equal importance, but to a lesser degree.
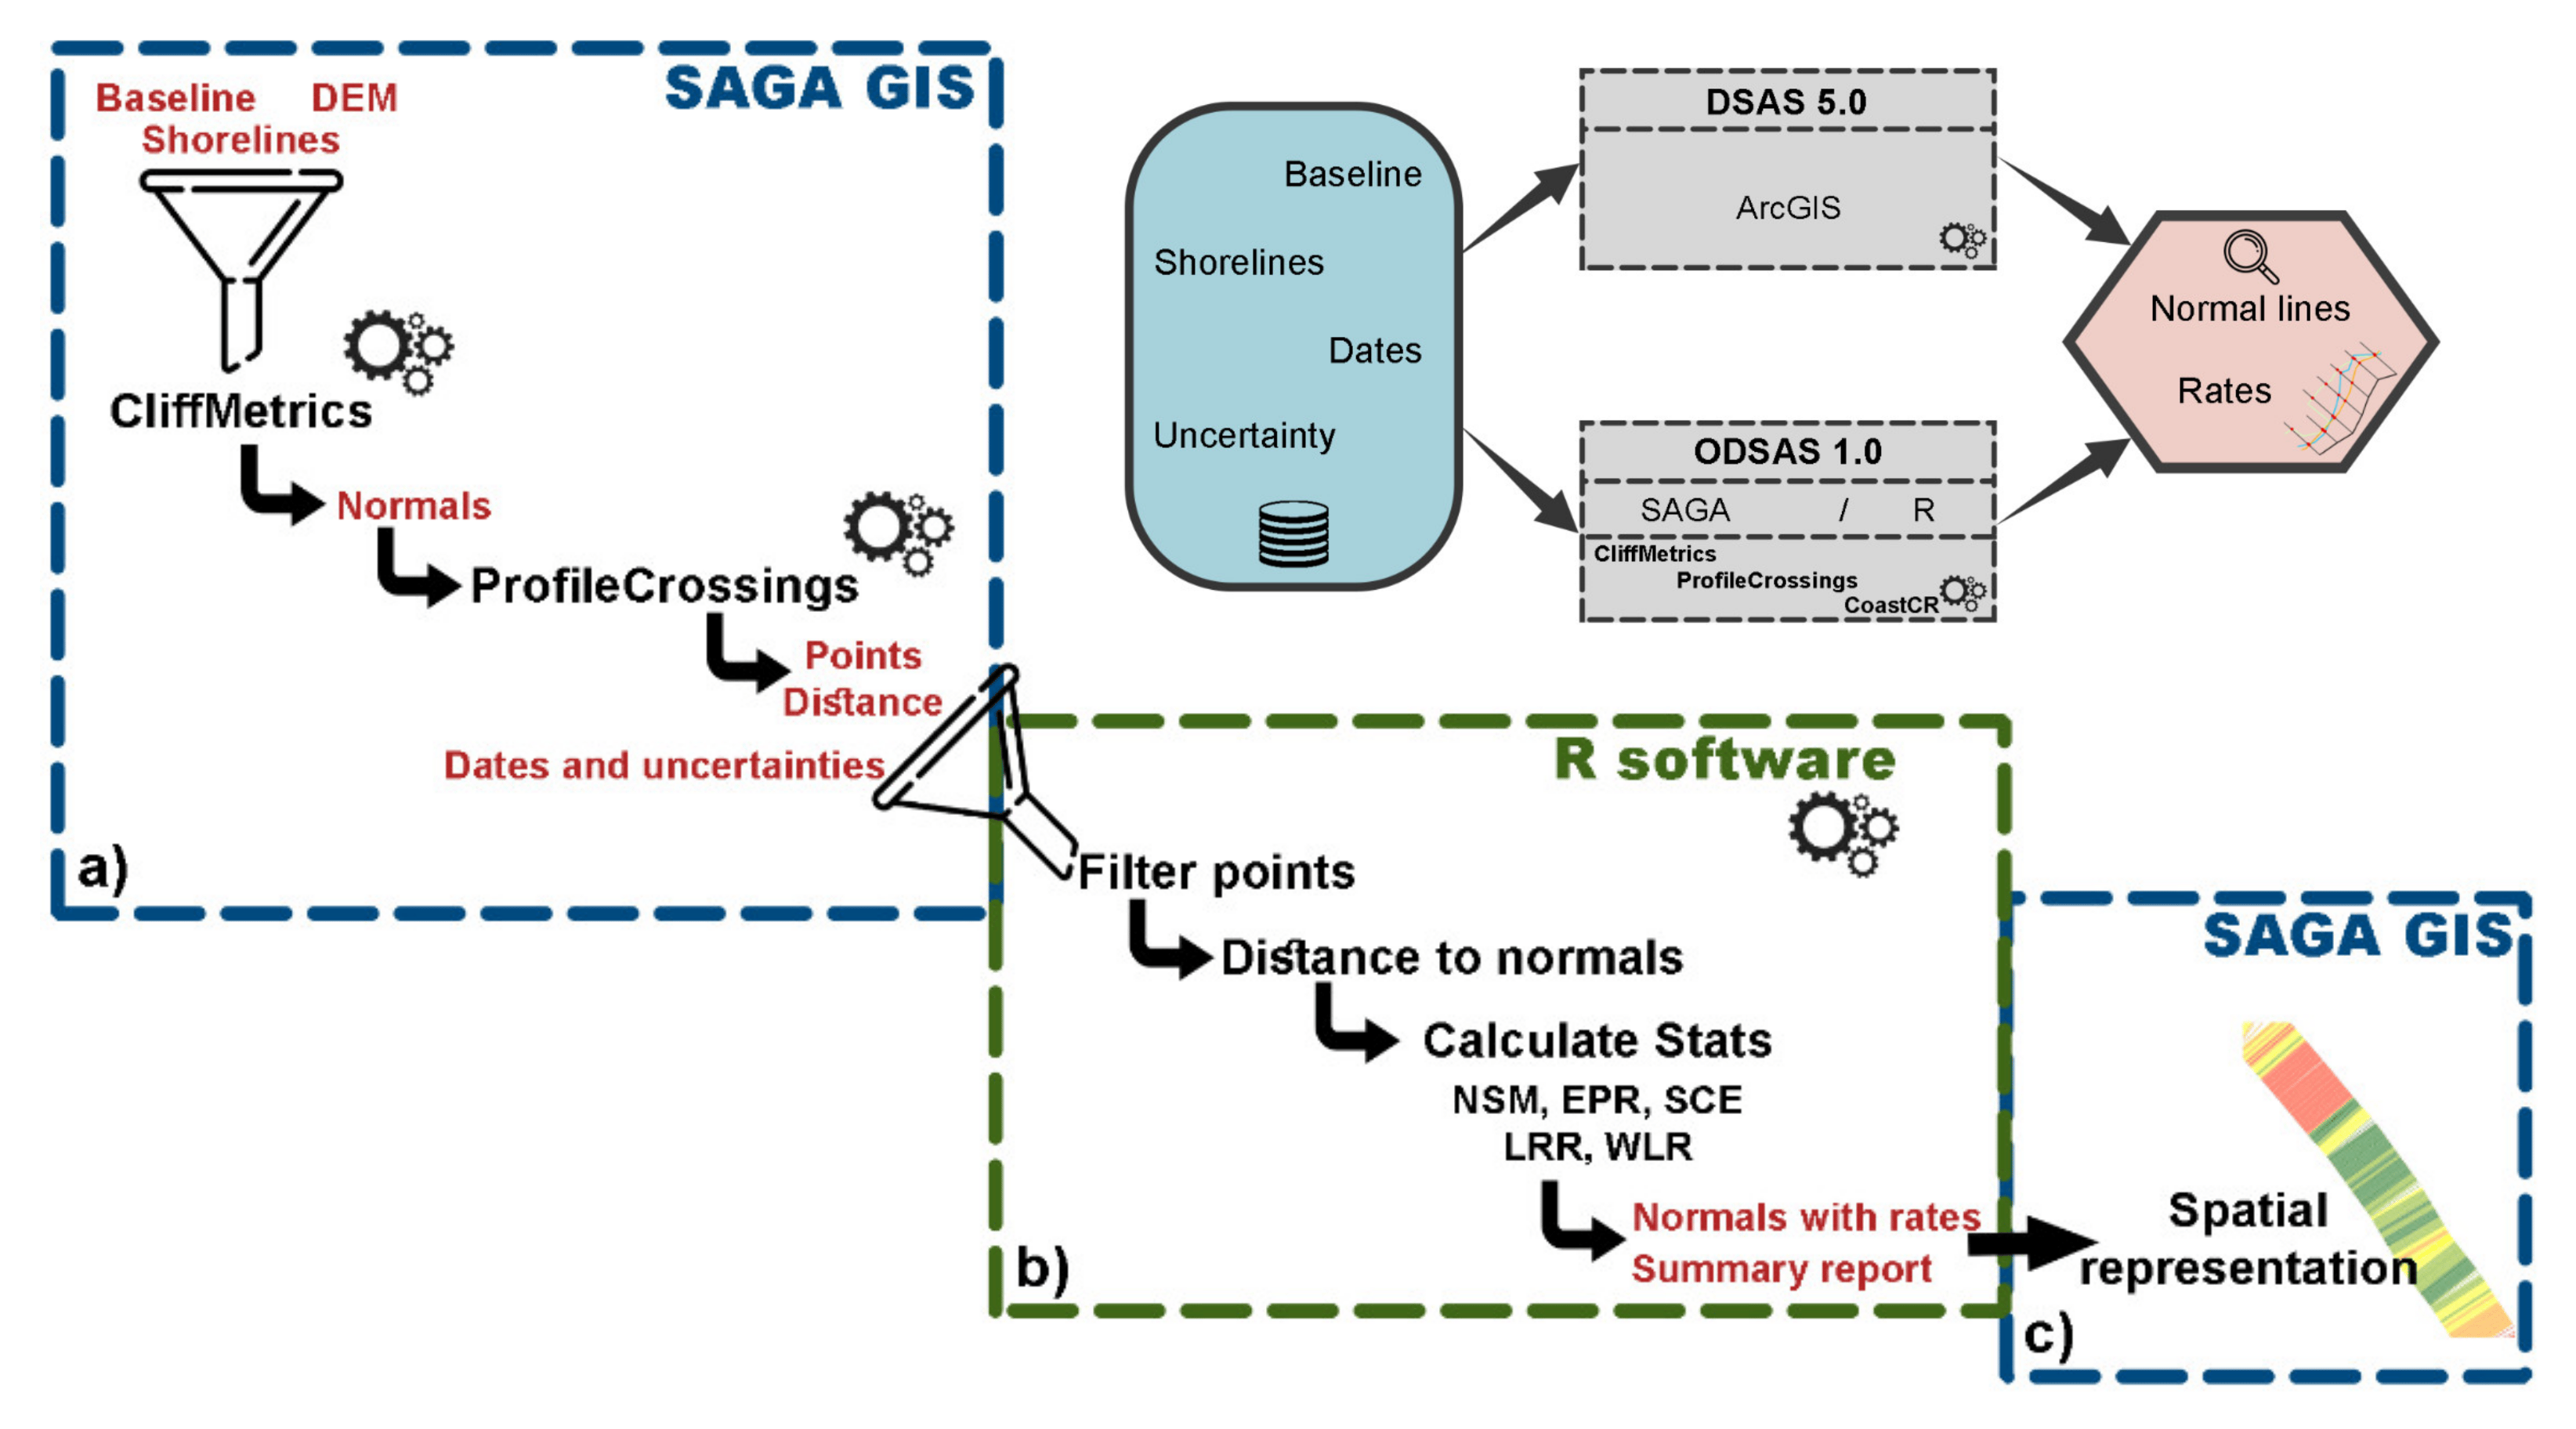
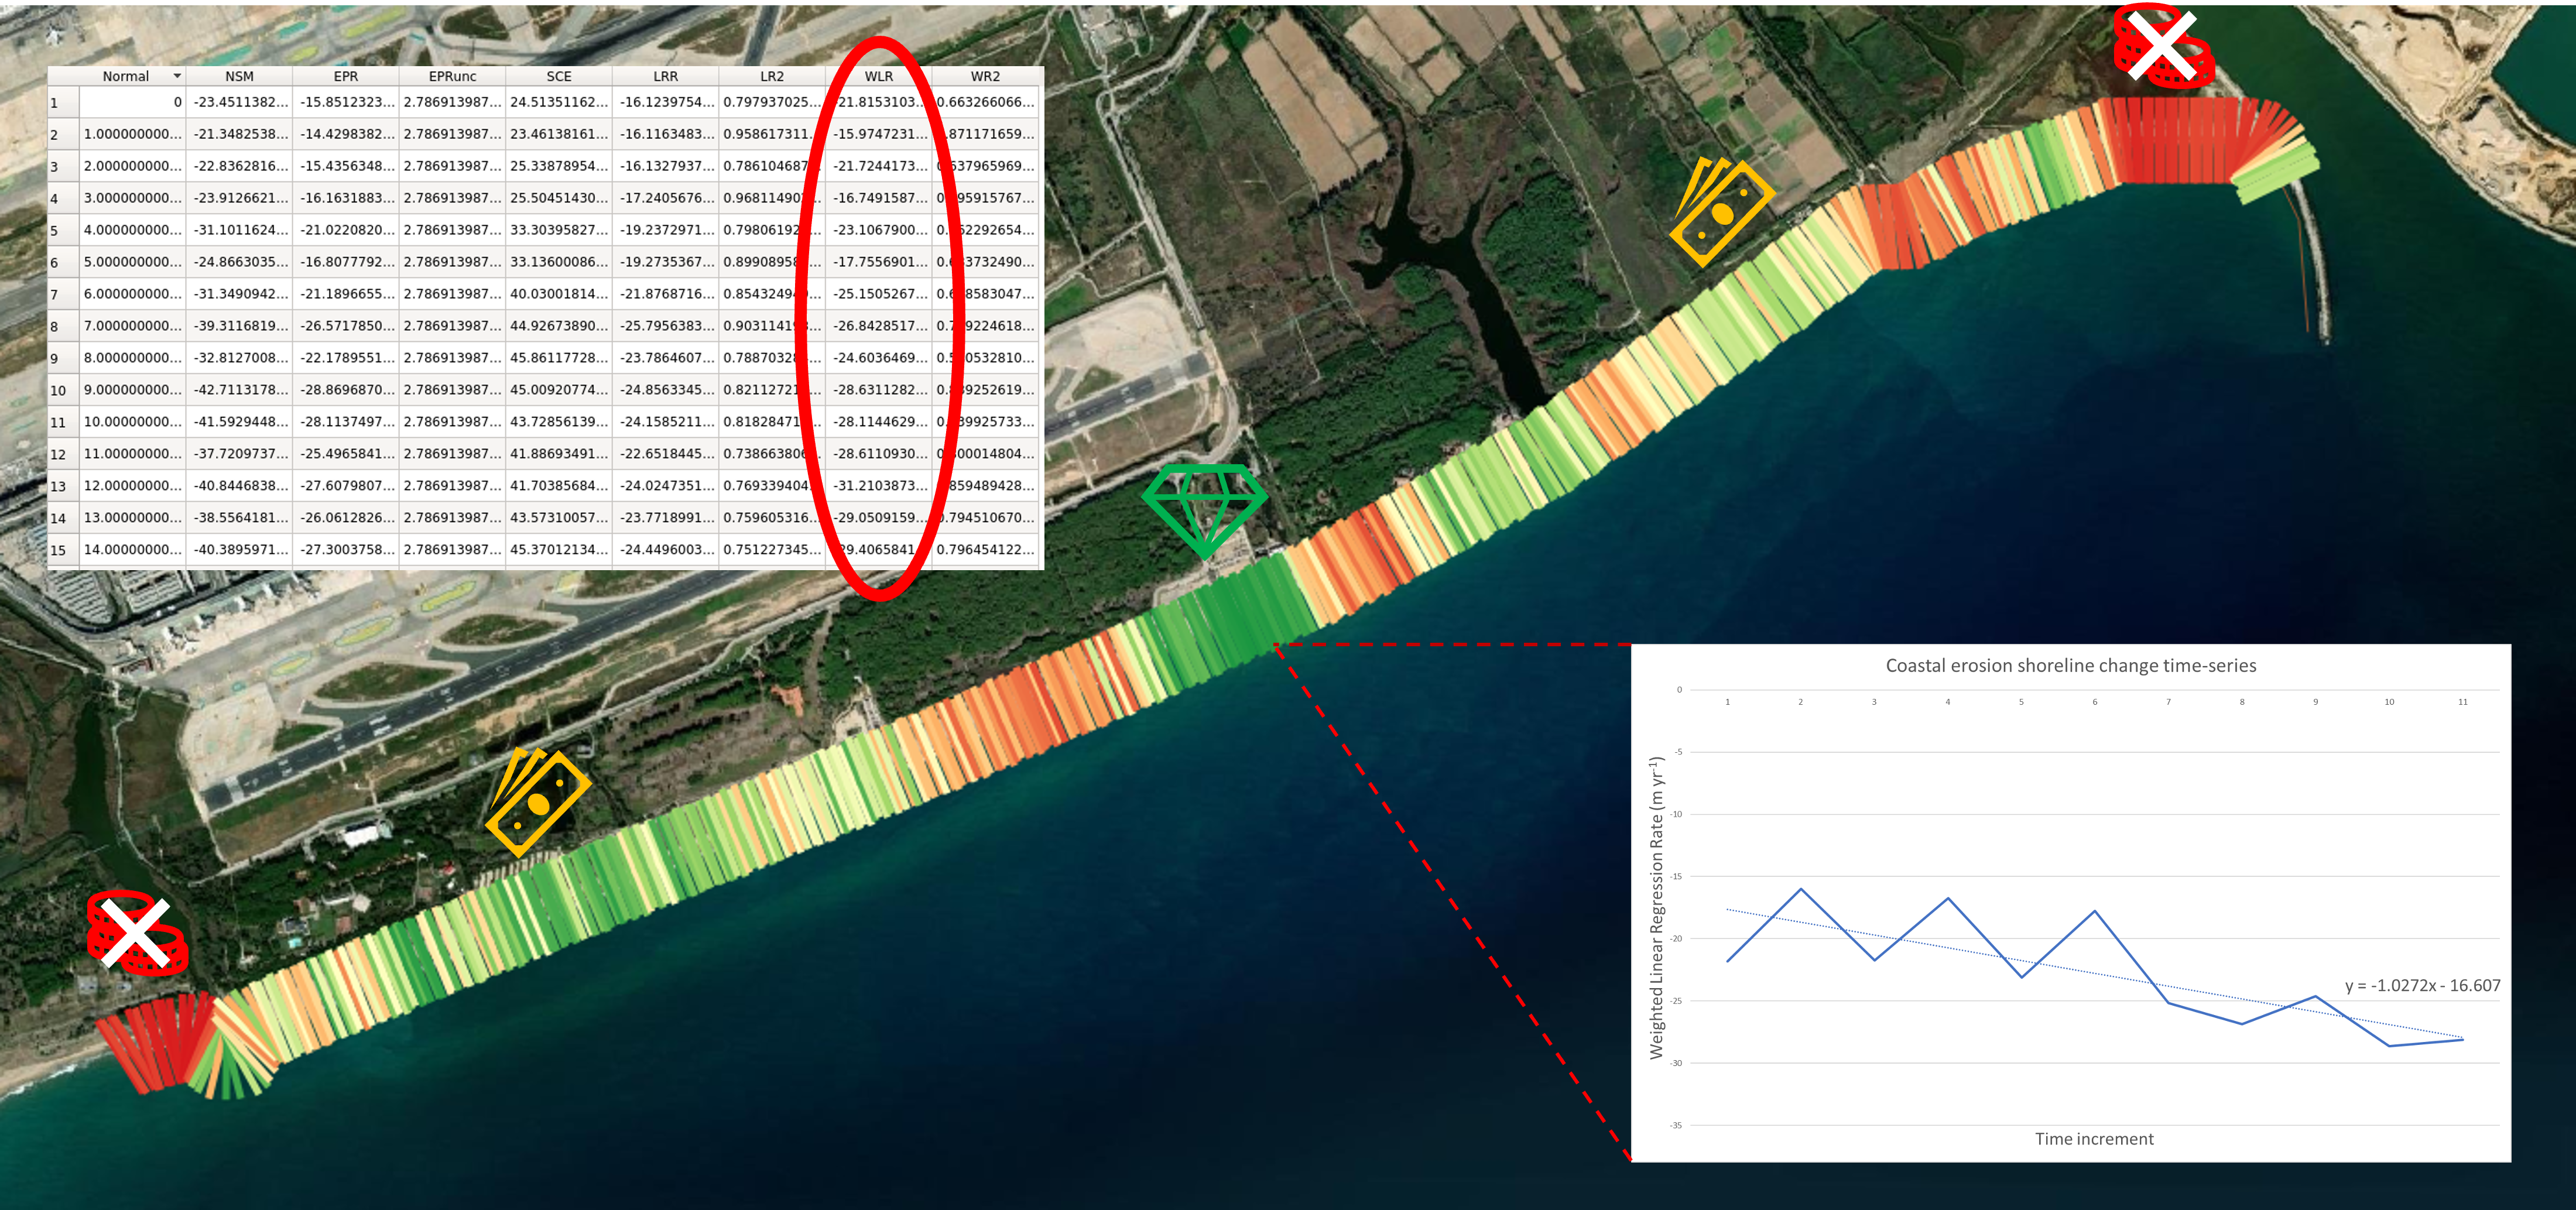
Coastal ecosystems are under increasing pressure from human activities and climate change. The ability to monitor and quantify changes in these ecosystems is essential for sustainable management. This study aims to develop a methodology to quantify changes in coastal ecosystems using Earth Observation data.
The utilization of Earth Observation in ecosystem accounting offers a powerful tool for assessing coastal ecosystems. Satellite data can conduct site-specific assessments, monitor processes at large spatial scales, and continually monitor temporal changes. When combined with auxiliary information, EO data offers a comprehensive approach to understanding and supplementing the assessment of ecosystem services.
As part of the ESA Coastal Erosion from Space Project (Ref:SO-RP-ARG-003-055), a methodology was developed and applied to track the extent of the coastline through the derivation of waterlines and shorelines. Waterlines are land/sea boundaries derived from remote sensing images, that are transformed into shorelines by applying corrections to account for tide, beach slope and wave conditions.
This study focuses on the quantification of coastal physical change and in particular in the type of change studies commonly referred to as shoreline change analysis (SCA).
The objectives of this study are to:
An open-source digital shoreline analysis system ODSAS integrates SAGA, an open-source GIS, the R programming language and CoastCR, that coastline time series and trend analyses using the baseline and transect approach.
ODSAS is a tool that allows the user to process and analyse shoreline data in a consistent and repeatable manner. The tool is designed to be user-friendly and to provide a range of statistical metrics that can be used to quantify the rate of coastal change.
The Coast Rates function is central to estimating five main metrics for each individual transect and generating aggregates for all transects, mirroring the functionality found in the USGS Digital Shoreline Analysis System DSAS tool. These metrics include Net Shoreline Movement (NSM), End Point Rate (EPR), Shoreline Change Envelope (SCE), Linear Regression Rate (LRR), and Weighted Linear Regression Rate (WLR), providing a comprehensive analysis of coastal dynamics.
These statistical metrics were used to provide an indication of the rate of coastal advance or retreat. These have been used to populate ecosystem accounting tables to determine the importance of regulating services in the coastal zone. Areas with faster rates of retreat can be determined to provide a low service value to regulating erosion as these areas are not resistant to erosion.
It was found that regions of the coastline have been retreating at a high rate, and have low ecosystem value, whereas there are other regions more resistent to coastal change and providing more ecosystem value, to assist policy-makers assess the return on investment of planned intervention, such as beach nourishment or sea defenses.
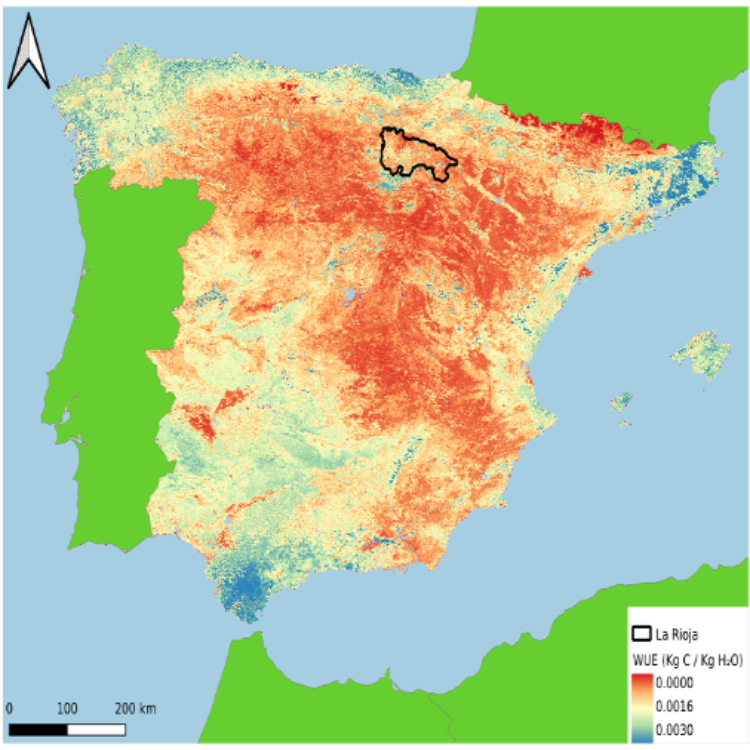
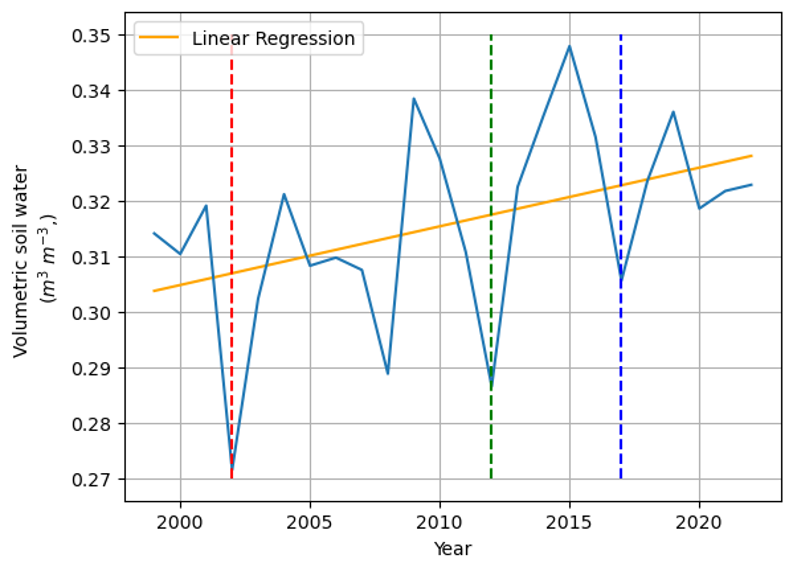
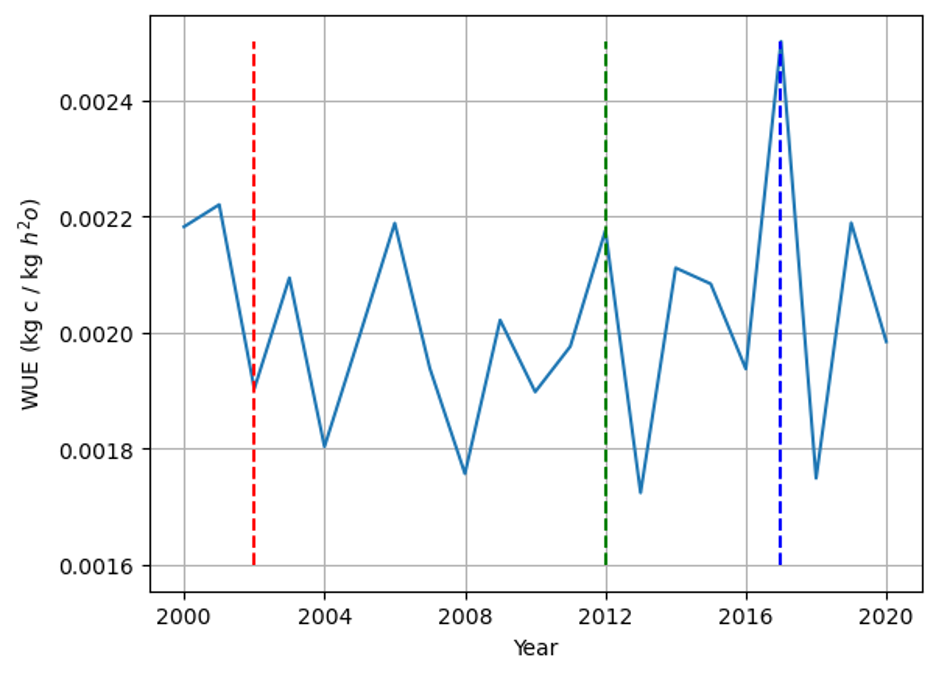
Global water management is becoming increasingly important. In Europe, agriculture is responsible for 24% of total water abstraction and pressure from population growth and climate change is placing water bodies under unsustainable stress. This pattern is most apparent in Central Western Europe (European Court of Auditors, 2021).
Water use efficiency (WUE) is a measure of the amount of water used to produce a unit of crop yield. It is a key indicator of the sustainability of agricultural practices and is used to assess the impact of water management strategies on crop yield.
Monitoring and managing the Worldwide water use has never been more important. Increasing global population is placing unprecedented pressure on water resources, with global freshwater use increasing six-fold since 1900. As water use is increasing, the quantity of water per capita, available from renewable sources (river basins and recharging aquifers) is decreasing. Agriculture and irrigation play a significant role in this decrease, with the sector responsible for 24% of all water abstraction within the European Union (European Court of Auditors, 2021).
Water management is such a critical topic that the United Nations have designated it a Sustainable Development Goal (SDG). SDG 6.4 relates to increasing water use efficiency (WUE) across all sectors, including agriculture (United Nations, 2024).
Within agriculture, WUE is used to monitor the efficiency of irrigation systems. Under irrigated systems, water use efficiency increases as plants are held under mild water stress. This stress causes plants to decrease transpiration and maintain productivity. Furthermore, fertilizers are added within the water in irrigation systems, so it pays to determine how effective the irrigation systems are, to minimise fertilizer leaching. Improving water use efficiency can also increase crop yield, especially in drier and semi-arid conditions.
WUE is one of many indices and other geophysical products derived from Earth Observation satellite remote sensing images; data now in abundance, with timeseries spanning over two decades, with near global coverage and frequent repeat times. These timeseries provide opportunities to observe long-term patterns. It is of interest to test the usefulness of these datasets, regarding water use in agriculture.
The purpose of this work is an initial investigation into water use efficiency and water management of agricultural land, within Europe. This purpose will be reached by achieving the following objectives:
This study is demonstrating the use of WUE products constructed from remotely sensed imagery. The “earth observation” methodology of integrated WUE will be used in this study. This was calculated as:
\[ \textit{WUE} = \frac{\textit{GPP}}{\textit{ET}} \]
Where GPP is Gross Primary Productivity (kg carbon /m2), and ET is evapotranspiration (kg water /m2). GPP and ET were collected from the Moderate Resolution Imaging Spectroradiometer (MODIS), at a spatial resolution of 500 metres, and a temporal resolution of every 8 days.
Volumetric Soil Water (VSW) was accessed from ECMWF ERA-5 Re-analysis. Level 4, at a depth of 100-289 cm, was used due to the dependency that vines have on soil moisture at this depth. Crop yield data was obtained from the Ministry of Agriculture and Fisheries (MAPA) for Spain (MAPA, 1999-2022).
The focus of this study will be to demonstrate the capability of Earth Observation data to assess how vineyards use water throughout the growing season. Spanish vineyards are being investigated due to their unique sensitivity to weather patterns. The homogeneity of their extent throughout the study area also aids this analysis due to the relatively low-resolution of earth observation products used within this study.
While this study remains a broad investigation into water management, there are three key questions that will be explored:
The dataset of available images and crop yield data was limited to 20 years and insufficient to resolve trends with any degree of certainty. Nonetheless, the study confirmed expectations that irrigation is effective in increasing crop yields. The z-score, a measure of variability within a sample, seems to indicate that irrigation promotes stability in the face of water stress, i.e. the distribution from the mean in irrigated plots is less than non-irrigated, but the sample size is too small for confidence.
Monitoring soil moisture in the most critical months of a vine growth demonstrates some impact on the final yield of a crop. VSW between February and May decreases dramatically in years when crop yield is also low. As expected, VSW does appear to mirror crop yield, especially between the years of 2012 and 2017.
Spring WUE appears to fluctuate considerably more than VSW, from year to year. It does appear that in drought years (such as 2012 and 2017), WUE increases, as would be expected based on the known physiological response when under drought stress, vines reduce evapotranspiration and, hence, increase in WUE. This begs the question of why, in 2002, a similar response wasn’t detected. However, in 2002 the water stress occurred in December, perhaps too early to affect the vines, but the detrimental effect on the cop yield was during harvest.
The investigation of vineyards throughout La Rioja has demonstrated a proof-of-concept for analysing integrated WUE in irrigation using freely available and post-processed earth observation data. This study posed three questions to capture the breadth of what was being explored. From this analysis, the answers to those questions are as follows:
Irrigated and non-irrigated crop yields demonstrate the same pattern over the past 20 years. However, irrigated crop yields are consistently higher than non-irrigated yields. A lower coefficient of variance (CV) for irrigated crops, compared to non-irrigated crops was apparent.
WUE is higher in irrigated plots than non-irrigated plots. This may sound counter intuitive. However, if vines are kept under a very small amount of manageable water-stress, productivity in the vine can continue, while evapotranspiration decreases, increasing WUE.
Decreased VSW, as expected, lead to a similar response in crop yield, and irrigated yield constituting as a larger proportion of the overall yield. This change was most evident in weather-stressed years, such 2002, 2012, and 2017. This is as expected, as the decrease in VSW suggests a lack of moisture available to vines’ relatively deep routes, and hence the onset of drought-like conditions. In these conditions, irrigated plots are more suited to yield, and hence the difference between irrigated and non-irrigated yield increases.
WUE derived from EO sensors has been demonstrated, if only in a limited sample, to have potential use in monitoring water stress and its impact on crop yield. However, it is only one of many indices or variables that are available from EO remote sensing, many having likely relevance to monitoring agricultural water use. And viniculture, like all agriculture, has many significant factors to consider in addition to environmental factors. Soil type, topography, root stock and grape varieties, all contribute to productivity and, hence, yield.
The analysis suggests that irrigated yields are more consistent throughout weather stress, and that VSW is in-part related to a successful crop yield. This work also suggests that during weather-stressed years the ratio between irrigated and non-irrigated yield volume is in favour of irrigated yields. This suggests a further reliance upon irrigated yields in times of low soil moisture and low WUE. A preliminary plot-level study also suggests that irrigated plots have a higher WUE than non-irrigated plots.
This work would be improved upon by the access of higher resolution imagery, and detailed plot-level data. This would allow a more investigative approach which would consider multiple irrigation systems and wine varieties, in the three distinct regions of La Rioja. Specifically, advancements in Sentinel GPP and Sentinel ET would aid the production of a higher-resolution WUE product. A drought index, such as TVDI, would also more clearly quantify areas that are experiencing drought-induced stress.
This privacy policy ("policy") will help you understand how ARGANS Limited ("us","we","our") uses and protects the data you provide to us when you visit and use the marineplastics.argans.co.uk website.
We reserve the right to change this policy at any given time. If you want to make sure that you are up to date with the latest changes, we advice you to frequently visit this page.
When you visit this website, we collect a data profile regarding your online behaviour on our website. This may include your IP address, user-agent string, browser type, operating system, referral URLs, device information (e.g., device IDs), device settings, mobile carrier name, pages visited, links clicked, the requested URL, and search terms.
This data is automatically logged, it satisfies a legitimate interest pursued by the controller, ARGANS, [GDPR Article 6(1)f] to comply with standard security practices, protecting our legal rights and interests, and enforcing our rules and policies.
A Google Analytics tracking cookie is attached to this webpage. The standard tracking cookie collects your IP address, which is considered by GDPR as personal information. Your IP address is anonymised before being sent to Google Analytics for processing, hence GDPR is satisfied and cookie consent is not needed.
Please note that cookies don't allow us to gain control of your computer in any way. They are strictly used to monitor visits to the website.
If you want to disable cookies, you can do so by accessing the settings of your internet browser.
Our website contains links that lead to other websites. If you click on these links ARGANS is not held responsible for your data and privacy protection. Visiting these websites is not governed by this privacy policy.
ARGANS is committed to data security and has done all in its power to prevent data theft, unauthorized access, and disclosure by implementing technologies and software, which help us safegaurd all data we collect.
Logged data is retained for a month and subsequently over-written.
The information contained in this website is for general information purposes only. The information is provided by ARGANS and while we endeavour to keep the information up to date and correct, we make no representations or warranties of any kind, express or implied, about the completeness, accuracy, reliability, suitability or availability with respect to the website or the information, products, services, or related graphics contained on the website for any purpose. Any reliance you place on such information is therefore strictly at your own risk.
In no event will we be liable for any loss or damage including without limitation, indirect or consequential loss or damage, or any loss or damage whatsoever arising from loss of data or profits arising out of, or in connection with, the use of this website.
ARGANS does not guarantee that this website will be secure or free from bugs and viruses. You are responsible for configuring your information technology, computer programmes and platform to access our site. You should use your own virus protection software. You must not misuse our website by knowingly introducing viruses, trojans, worms, logic bombs or other material that is malicious or technologically harmful. You must not attempt to gain unauthorised access to our website, the server on which our website is stored or any server, computer or database connected to our website. You must not attack our website via a denial-of-service attack or a distributed denial-of service attack. By breaching this provision, you would commit a criminal offence under the Computer Misuse Act 1990. We will report any such breach to the relevant law enforcement authorities and we will co-operate with those authorities by disclosing your identity to them. In the event of such a breach, your right to use our website will cease immediately.
Through this website you are able to link to other websites which are not under the control of ARGANS. We have no control over the nature, content and availability of those sites. The inclusion of any links does not necessarily imply a recommendation or endorse the views expressed within them.
You may link to any page(s) of this website, provided you do so in a way that is fair and legal and does not damage our reputation or take advantage of it. You must not establish a link in such a way as to suggest any form of association, approval or endorsement on our part where none exists. we reserve the right to withdraw linking permission without notice.
Every effort is made to keep the website up and running smoothly. However, ARGANS takes no responsibility for, and will not be liable for, the website being temporarily unavailable due to technical issues beyond our control.
Your use of this website and any dispute arising out of such use of the website is subject to the laws of England, Northern Ireland, Scotland and Wales. Unauthorised use of this website may give rise to a claim for damages and/or be a criminal offence.
This website and its contents is copyright of ARGANS Limited - © ARGANS 2022. All rights reserved
You are permitted to view, copy, and print any page(s) from this website subject to your agreement that:
You may not, except with our express written permission, distribute or commercially exploit the content. Nor may you transmit it or store it in any other website or other form of electronic retrieval system.
All trade marks and logos reproduced in this website which are not the property of, or licensed to, the operator are acknowledged on the website.
While every effort has been made to acknowledge is this website uses another person's copyrighted work we acknowledge that unattributed elements are used, that were considered free-to-use under creative commons licensing, may be copyrighted. In such cases all rights and credit go directly to the rightful owners. No copyright infringement was intended.
Contact webmaster@argans.co.uk to if you own copyright on an image included on the Site and would like it removed.